

Issued October 2022/Updated June 2025
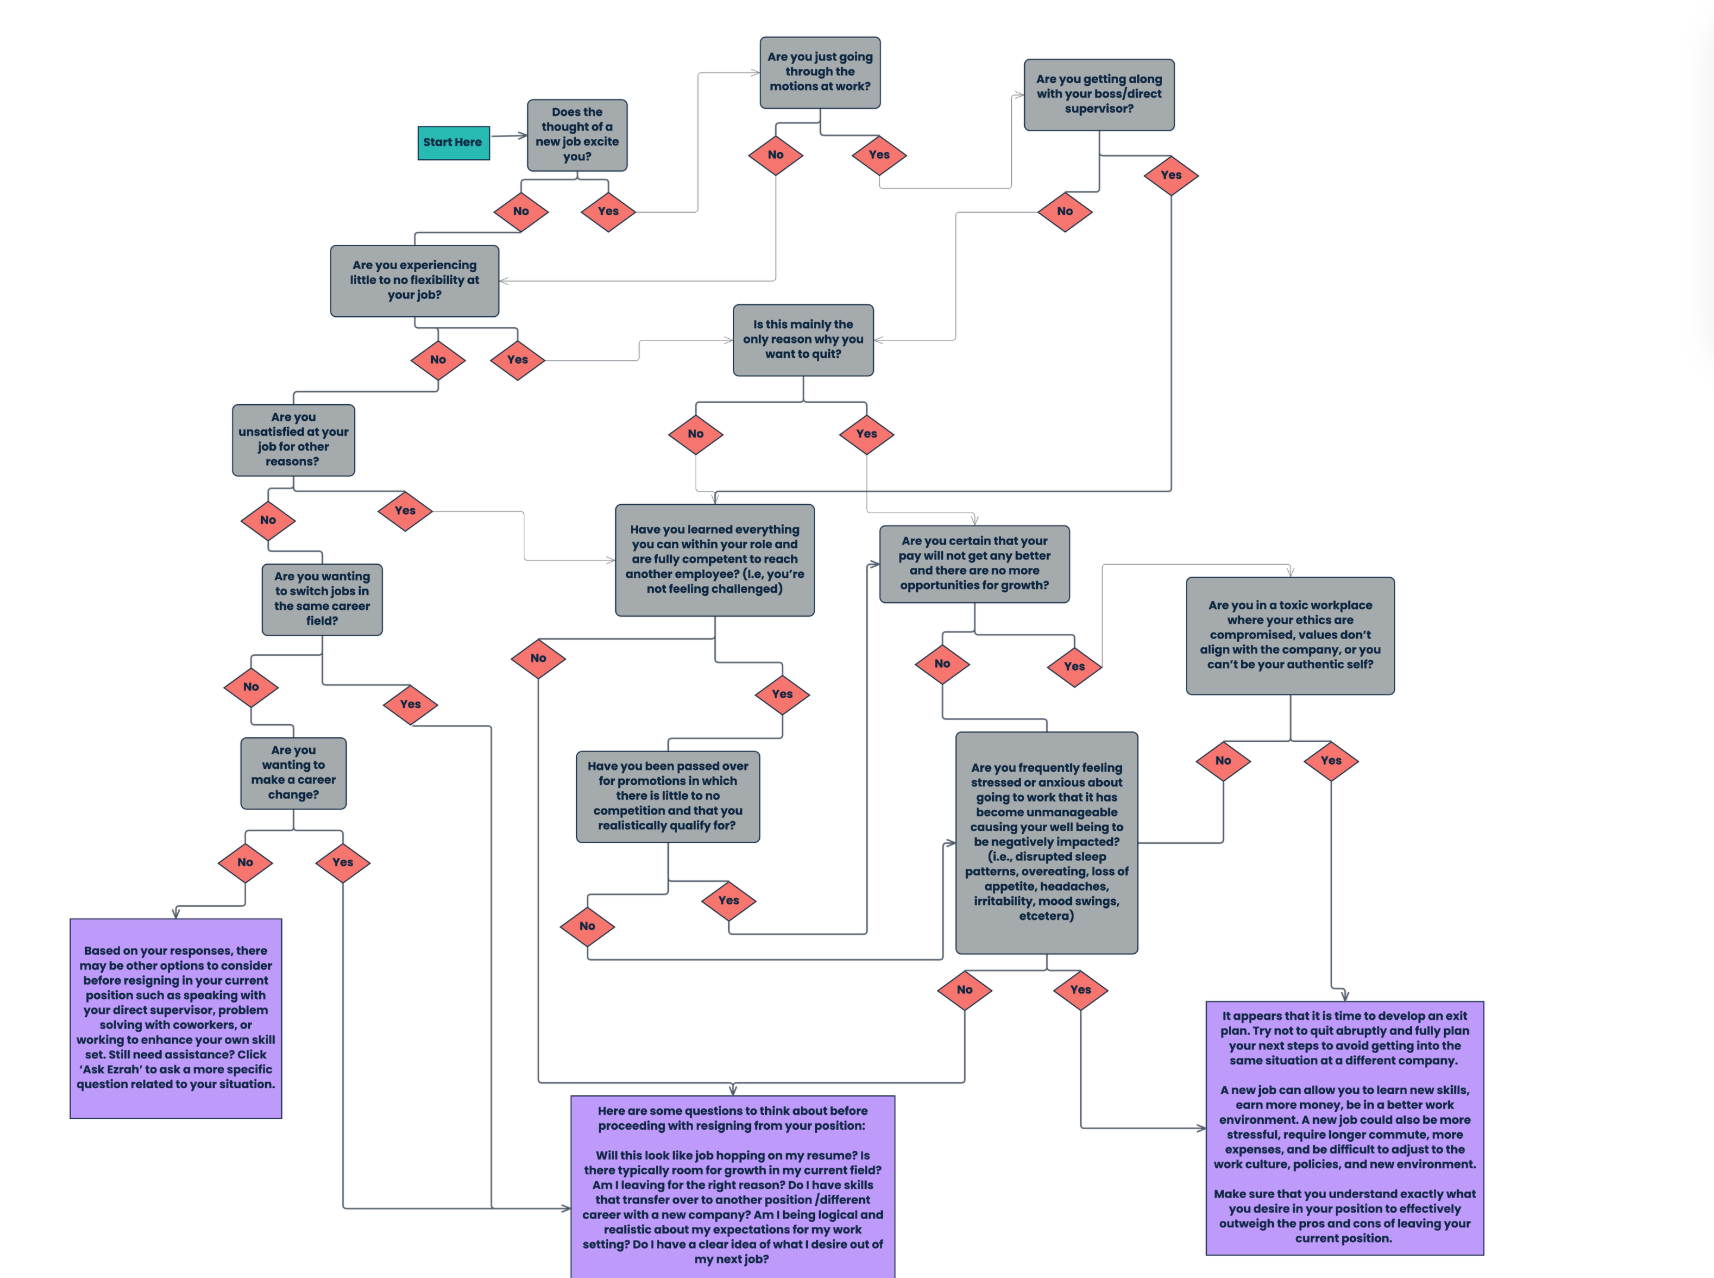
(If you are viewing this flowchart from a phone or tablet, you may need to zoom in)

References
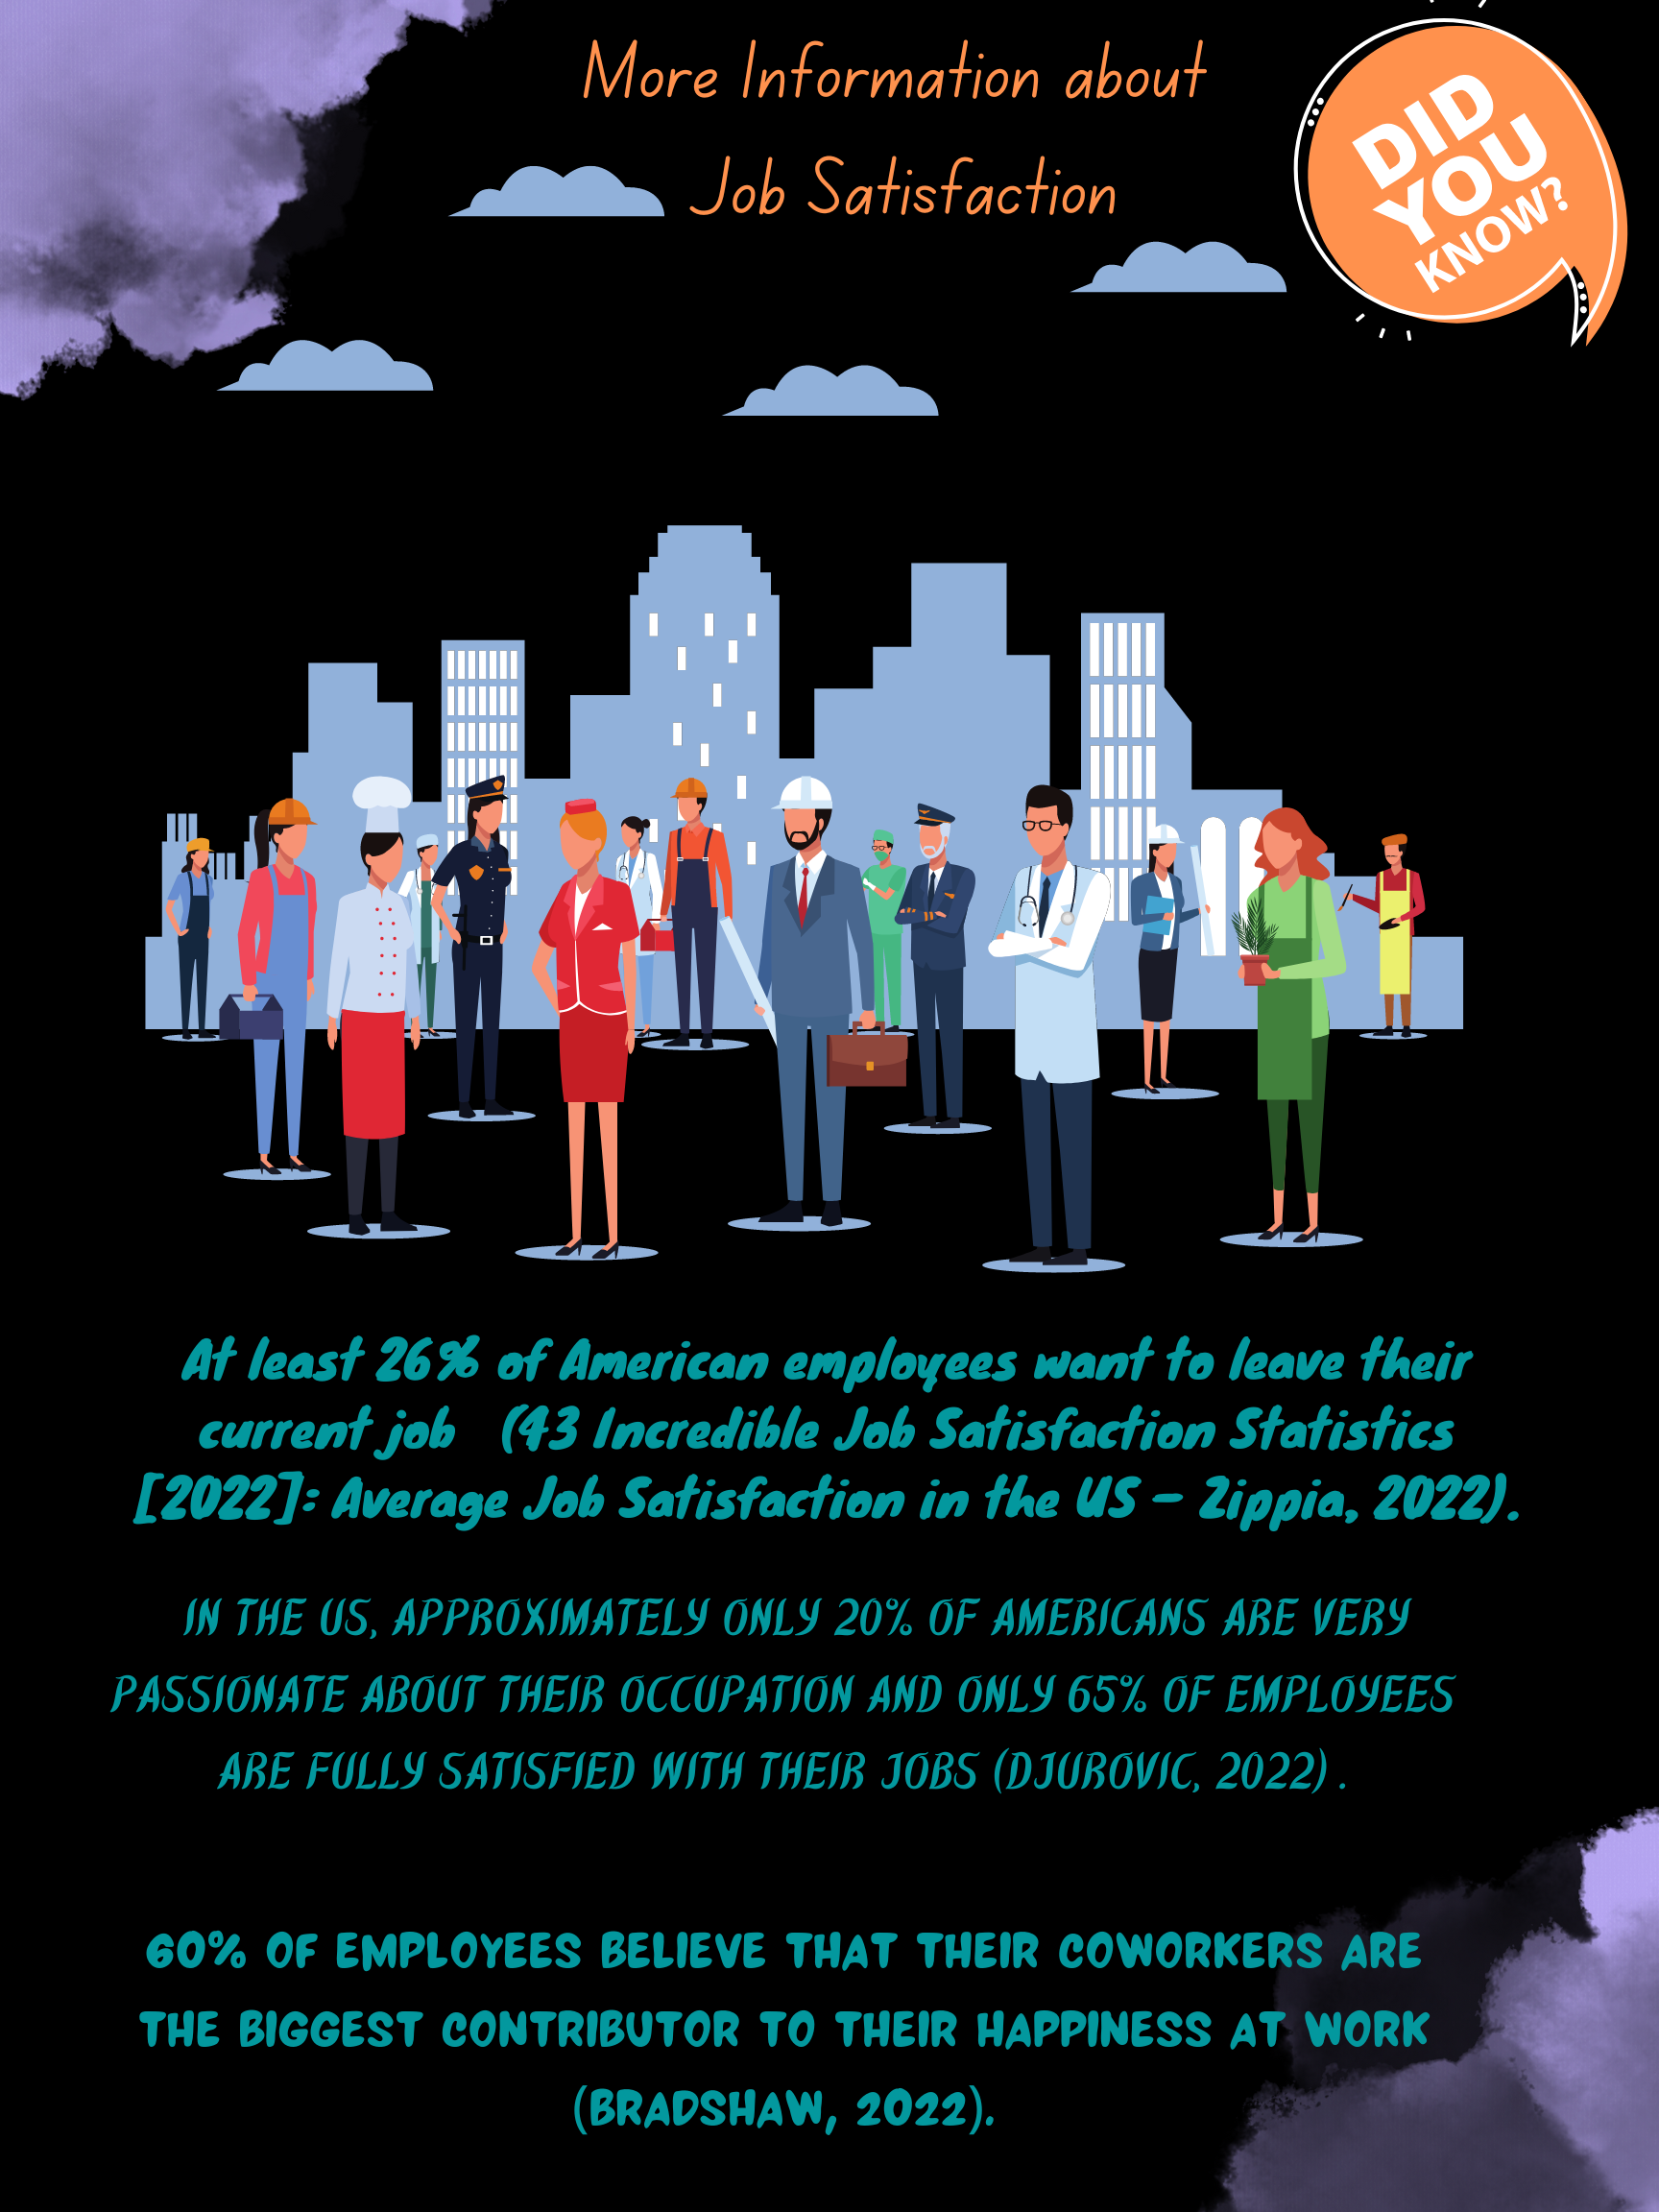
43 Incredible Job Satisfaction Statistics [2022]: Average Job Satisfaction In The US – Zippia. (2022, September 14). https://www.zippia.com/advice/job-satisfaction-statistics/
Bradshaw, R. (2022, August 29). 11 Surprising Job Satisfaction Statistics (2022). Apollo Technical LLC. https://www.apollotechnical.com/job-satisfaction-statistics/#:%7E:text=In%20the%20U.S.%2C%2065%25%20of,come%20to%20the%20right%20place.
Djurovic, A. (2022, March 15). 22 Interesting Job Satisfaction Statistics You Should Know. from https://goremotely.net/blog/job-satisfaction-statistics/
The Great Resignation 2021 & 2022 Statistics. (2022, April 11). EDsmart. https://www.edsmart.org/the-great-resignation-statistics/
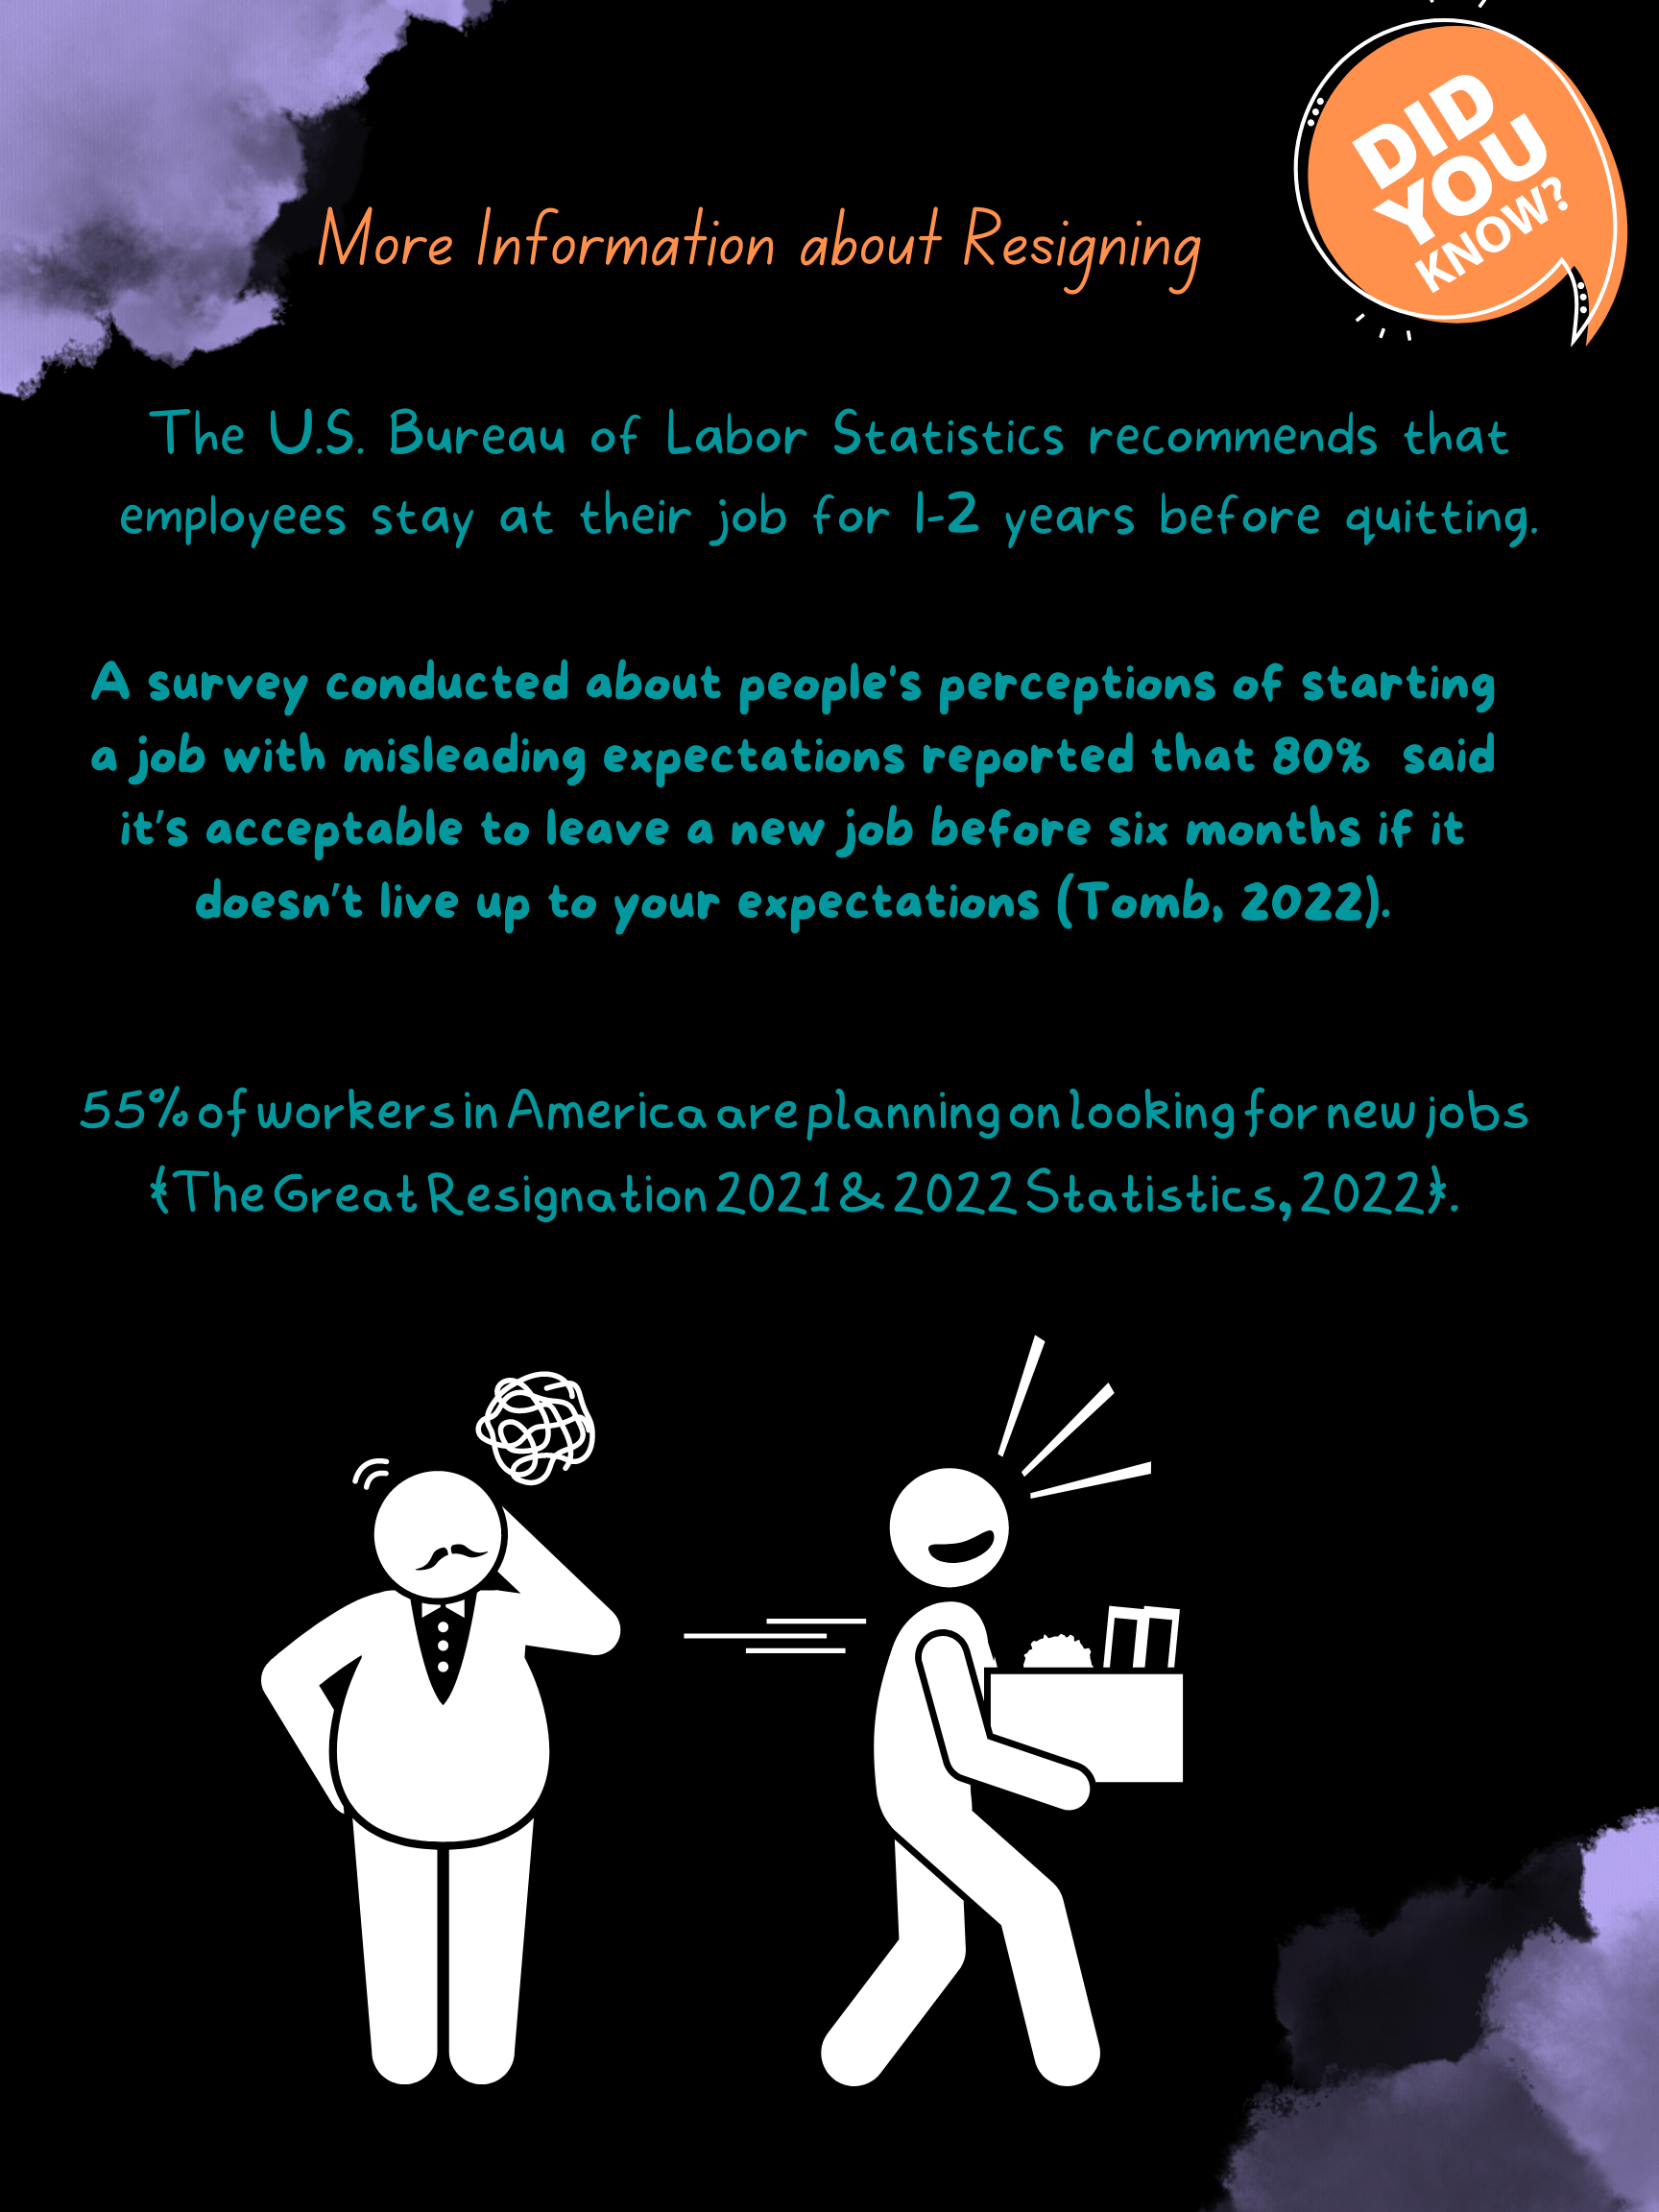
Tomb, D. (2022, August 30). 72% of Muse Survey Respondents Say They’ve Experienced “Shift Shock.” The Muse. https://www.themuse.com/advice/shift-shock-muse-survey-2022